
Market analysis is an essential part of any trading strategy. It involves using the information available to you now, to make educated predictions as to how a market will behave in the future.
There are two main types of market analysis:
- Technical analysis focuses exclusively on the price movements of a market, while fundamental analysis looks at the wider economic factors that can affect its price;
- You'll often find traders identifying themselves as either technical or fundamental analysts, extolling the benefits of one over the other. Though ultimately a grasp of both forms of analysis will give you the best platform to trade the financial markets.
In this course we'll be focusing exclusively on technical analysis.
What is technical analysis?
Technical analysis is based on the premise that what happens in the past can be used to predict what might happen in the future - although of course you have to remember this can never be guaranteed, which means technical analysis shouldn't be used in isolation.
Technical analysis what traders use to study the historic price movements of markets. And by far the easiest way to do this is by looking at charts.
By examining the trends and patterns in market prices, technical analysts can interpret the behaviour of buyers and sellers to help give an indication of where the market could go next. Since there are certain types of behavioural patterns that have occurred repeatedly in the past, it's possible to identify them as they emerge and predict the likely future movement of the market.
For example, if the share price of Big Pharmaceutical Company EFG keeps dropping to around the 100p level and then rising immediately afterwards, a technical analyst might choose to buy some shares the next time it falls to that price, predicting that the pattern will repeat itself.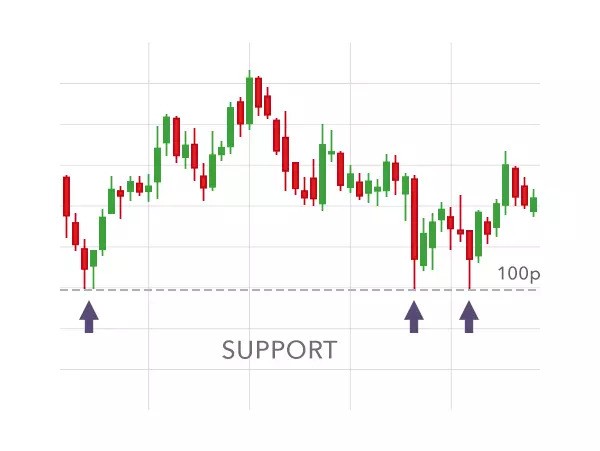
In the technical analysis world, the 100p level is called a support level. We'll study support levels and other patterns in more detail later in this course - but before we do that, in the next section we'll take a quick look at the three main types of chart you can use to analyse financial markets.
Support and resistance
Support and resistance are the building blocks of technical analysis, and many effective trading strategies can be based solely around them. In simple terms, support and resistance are like glass floors and ceilings which appear to limit a market's range of movement.
The reason these levels appear is due to the balance between buyers and sellers, or demand and supply. When there are more buyers than sellers in a market (or more demand than supply) the price tends to rise. And when there are more sellers than buyers (or more supply than demand) the price tends to fall.
Support and resistance are the turning points. For example, a support level occurs when a market that's falling halts its decline to move higher. This typically means that the balance of market participants is moving from a seller's market to a buyer's market. The low point of the move is seen as a level of support.
Resistance is the opposite. It is a level where a rising price reverses downward as a shift in the balance of buyers to sellers pushes prices lower. The high point is the resistance level.
Finding support and resistance
Areas of support and resistance are relatively straightforward to plot on a chart, you just need to find a level the market has reached, but not been able to break through. The more times the market reaches that level, but fails to go through it, the stronger that level of support or resistance is said to be. In fact, major levels of support and resistance can often become psychological barriers, with many traders buying or selling as soon as that level is reached - which serves to reinforce the effect.
It's important to note that major support and resistance levels are rarely exact figures. It's unusual for a market to hit exactly the same price time after time before reversing, so it's probably more useful to think of them as support or resistance zones.
As you can see in the chart above, the market often goes past, or stops short, of each support or resistance line - no matter how strong they appear to be.
When a market touches or jumps through support or resistance briefly before reversing, it's said to be testing the level.
Trends and channels
As you'll notice when you look at a chart, market prices do not generally rise or fall in straight lines over a period of time, but rather in a series of zigzags. The price will rise to a peak or a high, then drop to a trough or low. Despite this, the market will usually move in one overall direction or trend, and it's the relative positioning of the peaks and troughs that define this trend.
As you'll notice when you look at a chart, market prices do not generally rise or fall in straight lines over a period of time, but rather in a series of zigzags. The price will rise to a peak or a high, then drop to a trough or low. Despite this, the market will usually move in one overall direction or trend, and it's the relative positioning of the peaks and troughs that define this trend.
Trends charts
Trends are fairly easy to plot on a chart - all you need to do is connect two major peaks or two major troughs with a line. If you've drawn them correctly, trend lines will often act similarly to support and resistance levels. However, you should note that:
- It only takes two peaks or troughs to draw a trend line, but it takes three to confirm the trend;
- Just like support and resistance levels, the more times the trend line is tested, the stronger it is said to be;
- Steeper trend lines tend to be unreliable and break easily.